
Thinking about buying or selling in North Bergen but not sure how the market feels right now? You are not alone. After a wild few years, the Hudson County market has settled into a slower, more thoughtful pace where strategy matters. In this guide, you will learn what is shaping prices, how inventory looks by property type, and the key numbers that can help you time your move with confidence. Let’s dive in.
North Bergen market snapshot
North Bergen sits inside the high-demand Hudson County corridor near Manhattan. Demand stays resilient thanks to commuter access and urban amenities, but higher mortgage rates have cooled bidding and stretched timelines compared with 2020 and 2021. Regional trends show moderation rather than a crash, with pricing influenced by property mix and neighborhood factors. For the freshest picture, pair town-level MLS data with county context from NJ REALTORS market statistics.
Why inventory mix matters
North Bergen is not a one-size-fits-all market. The property types here attract different buyers and shape pricing.
- Condos and co-ops: Popular with commuters who want lower maintenance and access to transit. Pricing often tracks building amenities and HOA costs.
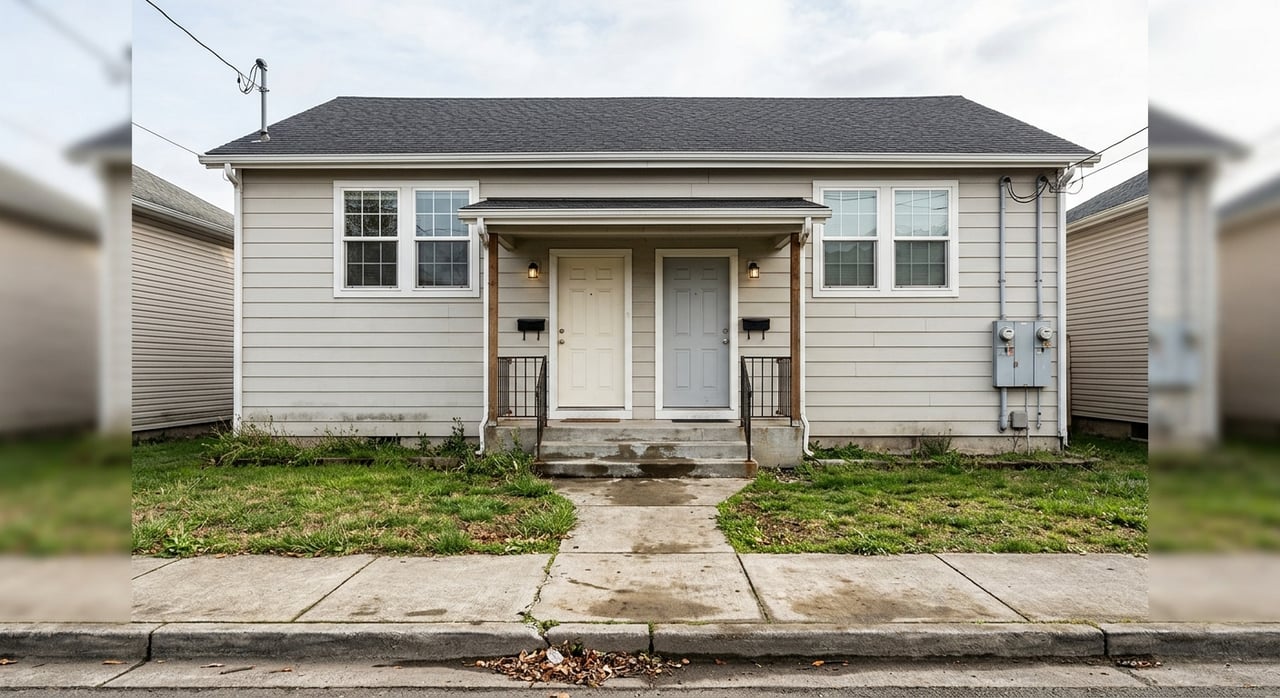
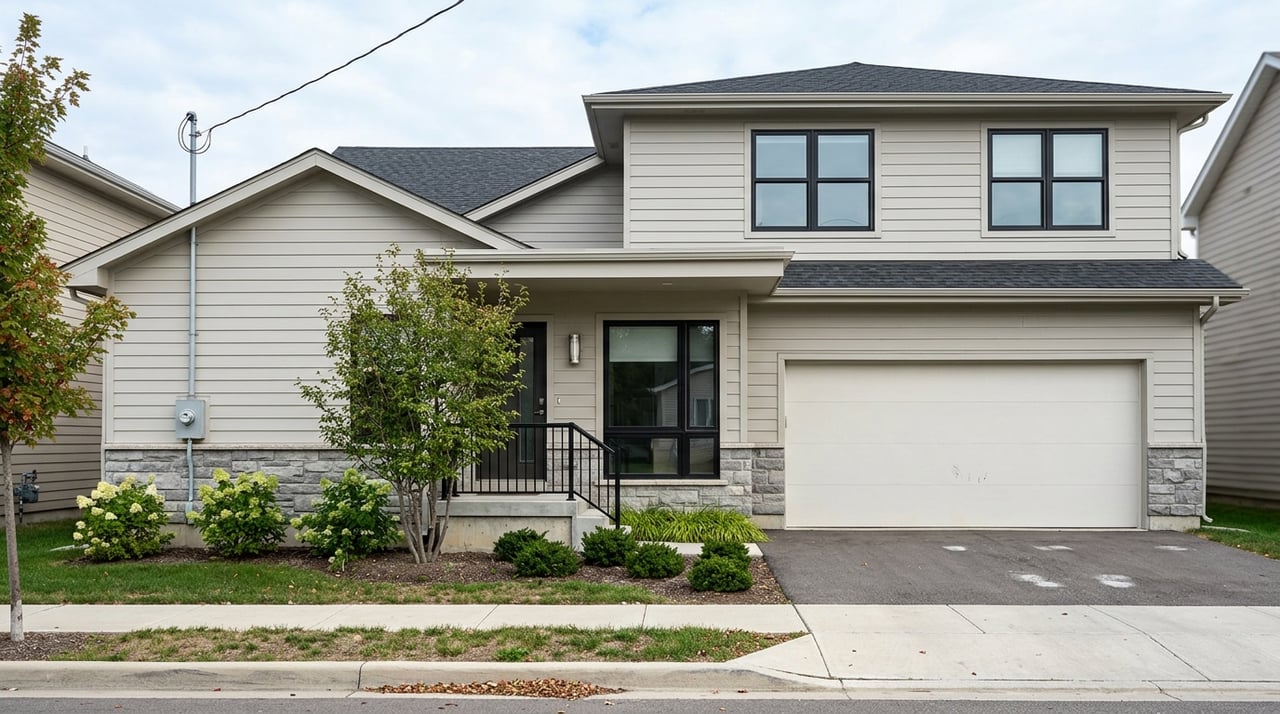
- Single-family homes: Limited supply in dense areas can make this segment sensitive to pricing and condition. Well-presented homes still draw attention.
- Two- and three-family homes: Investor interest is strong. These sales involve rent rolls, leases, and inspection scope that differ from single-family deals.
If you compare the overall median price without looking at property type, you can miss important shifts. Ask for a breakdown by condos, single-family, and multi-family to get a true read.
Key metrics to watch
To understand direction, watch these core numbers and what they usually signal:
- Median sale price: Shows the middle of closed sale prices over the last 12 months. Medians smooth out outliers.
- Median days on market (DOM): Rising DOM often indicates cooling demand or overpricing.
- Active listings and new listings: Show current supply and the pace of fresh options.
- Months of inventory (MOI): Active listings divided by average monthly sales. Under 3 months suggests a seller’s market. Three to 6 months is balanced. Over 6 months leans buyer’s market.
- Sale-to-list price ratio: A typical range near 98 to 100 percent means homes are selling close to asking. Lower ratios point to more room for negotiation.
Use a 12-month view for price and sales volume to reduce seasonal noise, and a 3 to 6-month window for DOM and MOI to catch recent momentum.
How to read today’s numbers
You do not need to be a data expert to spot the trend. Use this simple lens:
- If DOM is up and the sale-to-list ratio dips below 98 percent while inventory rises, buyers have more leverage.
- If MOI stays under 3 months for condos but single-family MOI is higher, buyers may find more negotiating room in the single-family segment.
- If the overall median price nudges up but MOI rises too, the price move might be driven by a few higher-end closings rather than broad strength.
Quick checklist to review with your agent:
- Confirm the 12-month median price by property type.
- Pull a current active-listing snapshot by type and compute MOI.
- Compare 3-month new listings and pending contracts to gauge near-term direction.
- Note any atypical sales that could skew results, like bank-owned or highly distressed properties.
Commute and location factors
Commuter access is a big driver of local demand. Many residents rely on NJ Transit bus service to Port Authority, and nearby towns offer Hudson-Bergen Light Rail connections and transfers at Secaucus Junction. Ferries from Weehawken provide another option to reach Midtown and Downtown via NY Waterway ferry routes from Weehawken. For a deeper view of how people travel and how long it takes, explore the American Community Survey commuting data.
If you plan to commute, focus on proximity to major bus corridors, park-and-ride options, and walkability to services. Hybrid work has also boosted the value of flexible space at home and access to local amenities.
Taxes, flood risk, and new builds
Property taxes and insurance can change your monthly budget. Review the current tax bill for any property you are considering and factor it into your affordability. Some areas near the waterfront or low-lying zones may carry flood risk, so check the FEMA Flood Map Service Center and ask your lender about insurance requirements. New construction or zoning changes can shift supply in specific blocks, so it helps to keep an eye on local planning updates and building permits.
Buyers: how to compete smart
The right plan depends on the segment you target.
- Get pre-approved and set a price ceiling that reflects today’s rates. Track weekly movements with Freddie Mac’s weekly mortgage rate survey.
- Ask for MOI by property type. Consider aiming where supply is deeper and DOM is longer.
- Compare sale-to-list ratios in your target buildings or blocks to guide your initial offer and concession strategy.
- For multi-family, review leases, rent history, expenses, and tenant rights. Build extra time for inspection and appraisal.
Sellers: pricing and timing
Pricing strategy and presentation matter when the market is cooler.
- Price within your property type’s current range. Anchor to the last 6 to 12 months of comparable closed sales.
- Watch MOI and DOM as you choose your pricing band. The goal is to be the obvious value among your closest comps.
- Optimize condition. Minor repairs, paint, and staging can reduce DOM and support stronger offers.
- For multi-family, prepare documentation early. Share leases, utility splits, and permits up front to reduce delays.
How we can help
You deserve clear guidance that fits your goals, whether you are buying your first condo, selling a single-family home, or analyzing a two-family investment. I combine neighborhood-level knowledge with data, digital marketing, and bilingual service to make the process smooth and transparent. From pricing and prep to tours, negotiations, and closing, you will have a plan tailored to North Bergen’s market dynamics.
Ready to talk strategy or get a quick valuation? Connect with Barbara Deleon Perez for a friendly, local conversation. Hablo español.
FAQs
What is months of inventory and why it matters in North Bergen?
- MOI measures how long it would take to sell current listings at the recent sales pace; under 3 months often favors sellers, while 3 to 6 months is balanced.
How competitive are condos versus single-family homes?
- Condos can move faster near strong transit, while single-family homes may see more price sensitivity due to limited supply and higher list prices.
How do mortgage rates affect my buying power?
- Higher rates increase monthly payments and can reduce your price ceiling, so track trends with Freddie Mac’s weekly mortgage rate survey.
Which commute options drive demand in North Bergen?
- Frequent buses to Port Authority, Light Rail access nearby, and NY Waterway ferries from Weehawken help attract NYC-bound buyers.
What should North Bergen sellers focus on right now?
- Price within your property type’s recent comps, watch MOI and DOM, and invest in condition to stand out among nearby listings.
How can I check flood risk before I buy?
- Enter the property address in the FEMA Flood Map Service Center and confirm insurance needs with your lender.